Section 1a (10 questions, 1 Point Each)
Provide a brief definition or short description of the following terms, dates, or historical figures:
Species: Answers may vary, need to be clear that species are defined based on reproductive isolation; species and freely breed within, but are isolated from other such groups (reproductively, geographically, etc)
Phenotypic plasticity: Changes in traits that are the result of the environment and not genetic-based evolution. Think barnacles in exposed vs. sheltered coves.
Fishery: Composed of three parts: Ecology, economy, and management
Thomas Malthus: Cleric, author, and major influence of Darwin. Wrote that species can grow faster than their resources- an argument used to justify terrible things
Robert Solow: Economist, wrote on sustainability. Argued for role of substitutes.
Logistic growth: S-shaped population growth. Basis of surplus production models and many stock assessments.
Natural selection: Process that was identified by Darwin to lead to evolution and local adaptation. In class/on quiz we discussed three premises/steps of the process
July 2, 1992: A terrible day in Newfoundland; start of the on-going northern cod moratorium.
ANILCA: Alaska National Interest Lands Conservation Act. Compensating Alaskan Natives for the loss of land but not lost hunting and fishing rights. Some mentioned Title 8 – making subsistence preference for RURAL residents (Native, white, other). Big consequences for way of life, resource rights, etc.
Primary production: The base of the food chain, photosynthesis production by organisms such as phytoplankton
Section 1b (5 questions, 2 Points Each)
the following graph that shows a surplus production curve from a hypothetical population of fish. Interpret the graph by responding to the following questions:
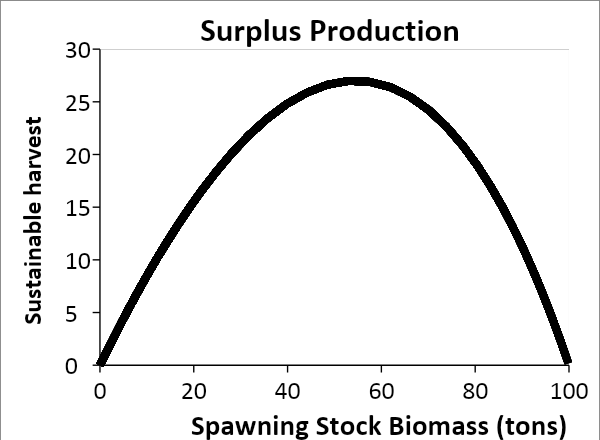
- Identify on the graph where the population is NOT growing (hint, occurs at two locations on the horizontal axis) (0,0) and (100,0)
- Give a biological reason for why the population is not growing at these levels of biomass
At zero there are no spawners and at 100 the stock is at carrying capacity so there are no resources.
- Identify on the graph AND estimate the spawning stock biomass that produces maximum sustained yield
Occurs at the half way point on the x-axis and is at approximately 55 tons
- Identify on the graph AND estimate the maximum sustainable harvest for this population
Occurs at the peak of the harvest curve and is a little over 25 (arbitrary units)
- If you were a manager of this fishery and tasked with maximizing employment of people, on what side of the curve would you aim to keep the spawning stock biomass? Why?
To maximize employment you would want to be fishing harder than you need to be, and thus you would be on the LEFT side of the curve closer to 0 stock biomass. This scenario is overfishing the stock, not underfishing, but it’s still ‘sustainable’ because this is a surplus production curve.
Section 1C (1 question, 5 Points)
- In your own words, explain why the plot shown in Section 1B above is sometimes referred to as ‘the most dangerous graph in fishery science.’ (hint, don’t be fooled into saying that it is a model and can be misinterpreted…you need to be more clear than that)
Problems arise when we think of maximum sustainable yield as a constant quantity; and it is impossible to really know what the MSY is until we have gone past it! And there is nothing harder to do in fisheries management than reduce effort as this puts people out of work and is never an easy political decision.
Section 2a (15 points)
While tide pooling along your favorite beach, you notice that the spines on the surf perch (family Embiotocidae) that inhabit the pools seems to vary. In the big pools the surf perch appear to have really large and dramatic spines, whereas the perch in the small pools have small and inconspicuous spines. Given that you know that spines are a defense against predators, provide a testable hypothesis for the patterns of spine size you observed, assuming that spine size is phenotypically plastic. Briefly describe how you might test your hypothesis.
Answers vary. I wanted to see a clear understanding that you could test for plasticity by modifying the environments of the perch and quantifying spine size within a generation (or life time of a perch).
Section 2b (10 points)
The graph below is the result of an experiment where perch from your favorite beach were collected and reared in the presence or absence of predators. What does this tell you about your hypothesis regarding spine size? Is it consistent with phenotypic plasticity? Why or why not?
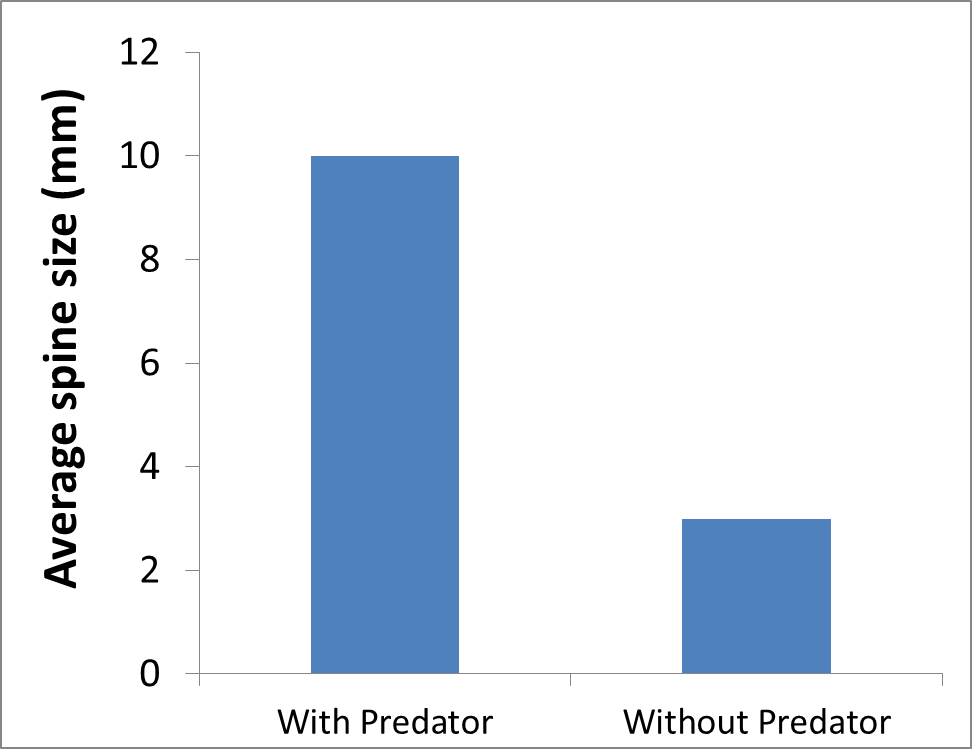
This is similar to the pattern we saw in class where carp grown in the presence or absence of pike have radically different body shapes. This is classic phenotypic plasticity.
Section 3 (20 points)
Pick and choose! Answer two (2) of the following 3 questions.
- What are the two factors that determine the number of fish that can be produced and harvested from an ecosystem? (hint, think food webs)
People either got this or they didn’t. The food web was a big hint. The number of trophic transfers and the efficiency of those transfers are the two factors that determine production and potential harvest in an ecosystem.
- During his time on the Yukon, Paul Greenberg saw the workings of a ‘mixed-cash’ economy. What did he observe and see that was evidence of that type of economy that is dominant in rural Alaska?
Most people got this one. Greenberg saw the protected traditional and customary use of salmon as barter. Trading is common and legal and a way that many rural economies roll.
- Compare and contrast Art McEvoy’s definition of sustainability to that of Robert Solow. Extra credit for those that can accurately incorporate unicorns into their answer.
McEvoy and Solow discussed sustainability and had considerations for future generations, but McEvoy was focused on maintaining the health of the relationships between the ecosystem, the economy, and systems of governance. In contrast Solow defined sustainability as future generations being at least as well off as we were; which at best is a vague concept. He focused his argument on the role of substitutes, which would have largely violated McEvoy’s definition.
Section 4 (30 points)
Thanksgiving is coming! Picture yourself chatting with a relative, who asks about what you’ve learned this term. Your conversation turns to northern cod of Newfoundland and they want to hear the whole tale. In your own words, tell the story of the rise and fall of northern cod, being sure to emphasize the causes and consequences of the collapse.
The grading rubric was simple on this one:
30 points for answers that were logically organized, thoroughly detailed with both the history leading to the moratorium and the causes of the collapse, as well as detailed describing the cultural and other (e.g. environmental) consequences of the collapse. Well written with few or no spelling errors or grammatical errors.
25 points for answers that were mostly organized, had few details (though some may have been incorrect) about the history and causes of the collapse, and consequences. Some spelling errors and grammatical errors.
20 points for answers that were too vague on details and not developed or logically organized. Spelling errors and grammatical errors common.